Overview
Comprehensive Dashboard
Our intuitive dashboard provides real-time insights into your data activities, making it easy to monitor and manage your ONTAP environments.
User-Friendly Interface: Navigate effortlessly through a clean and organized layout, allowing quick access to critical metrics.

Customize Your View
Select the filters you need to display only the metrics that matter to you.

Status
Show Normal or Ransomware Attack status
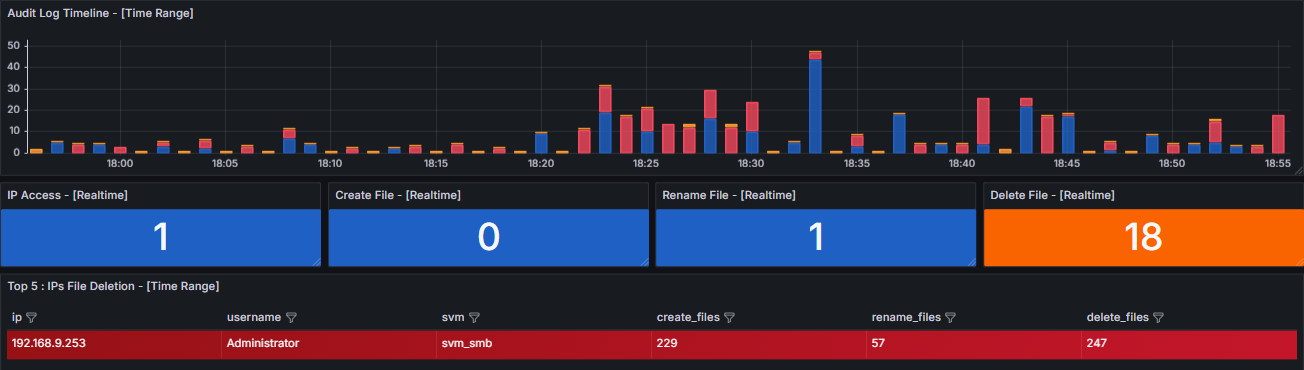
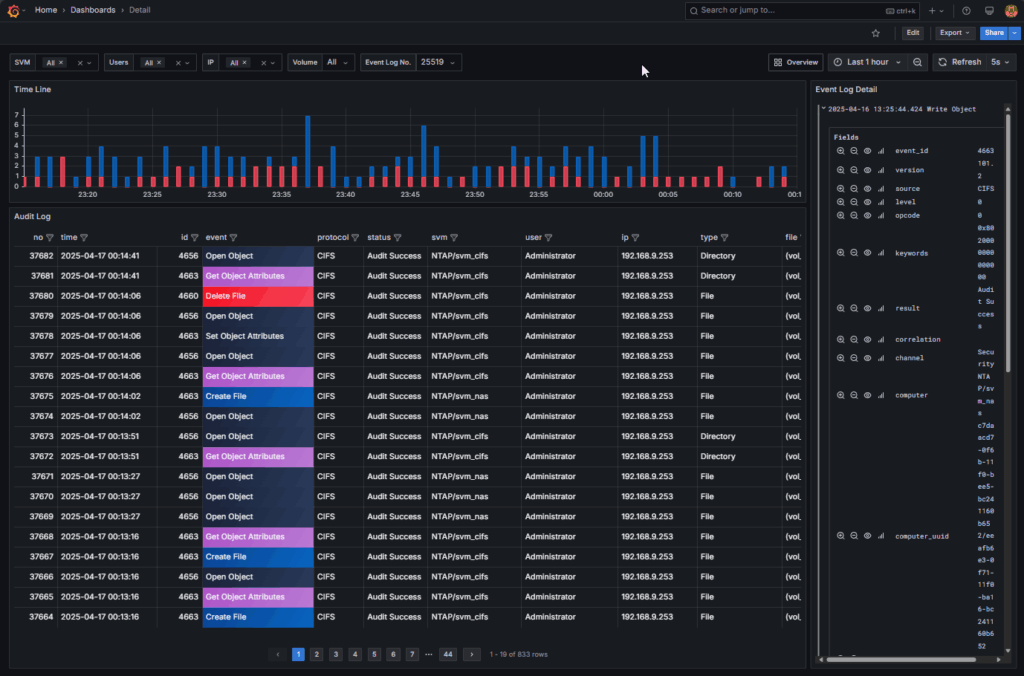
Audit Log Timeline [Time Range]
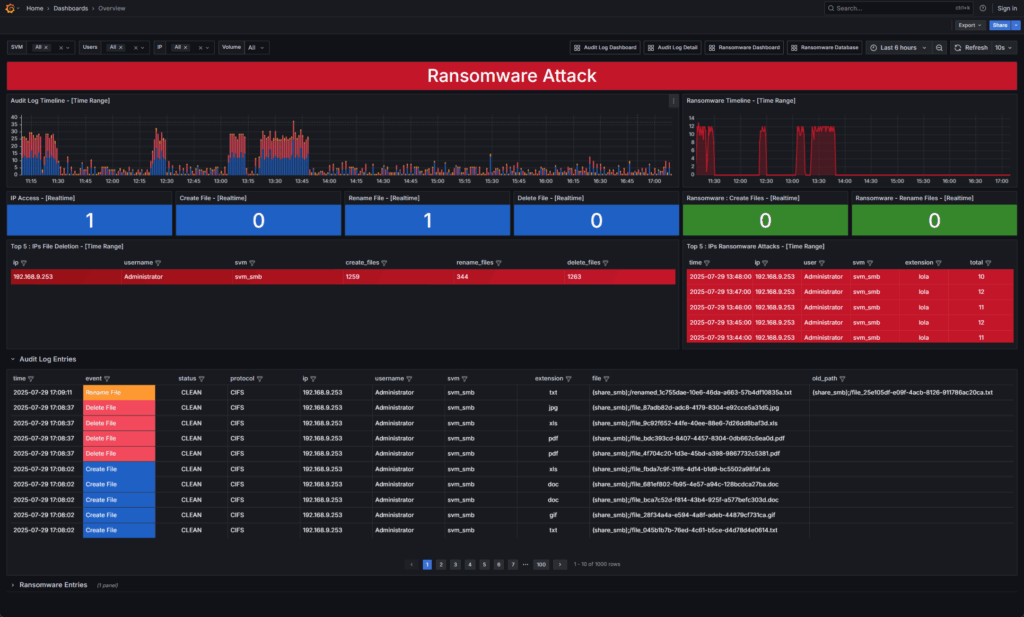
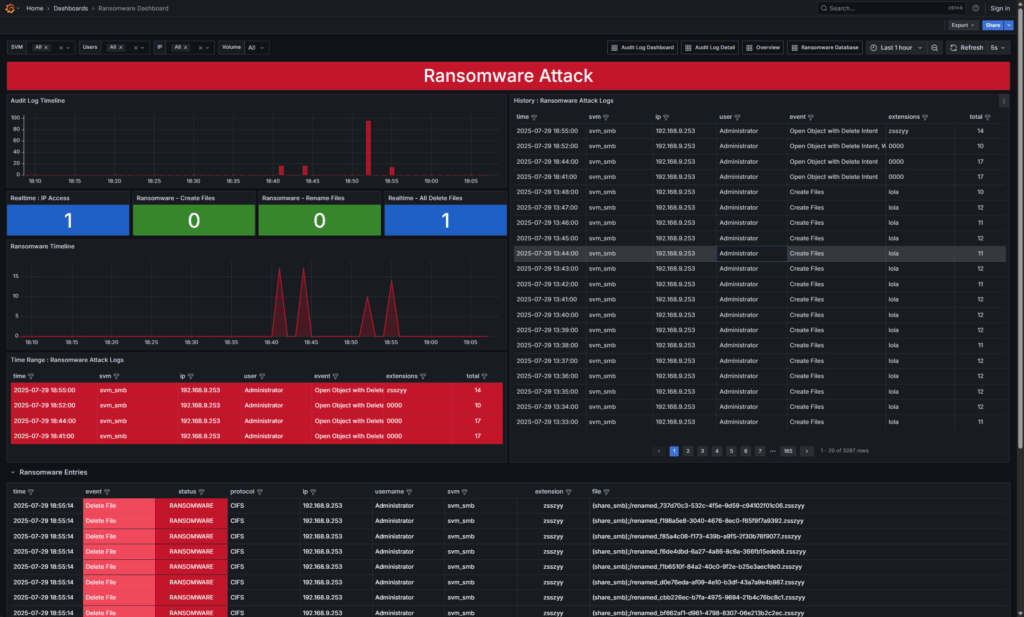
This dashboard is a powerful tool for Audit Log analysis, particularly in the context of detecting ransomware or other anomalous activities within file shares. By presenting data via timelines, real-time metrics, and top risky activities, it empowers administrators to quickly “visualize,” “identify,” “understand,” and “respond” to threats with maximum speed and efficiency.
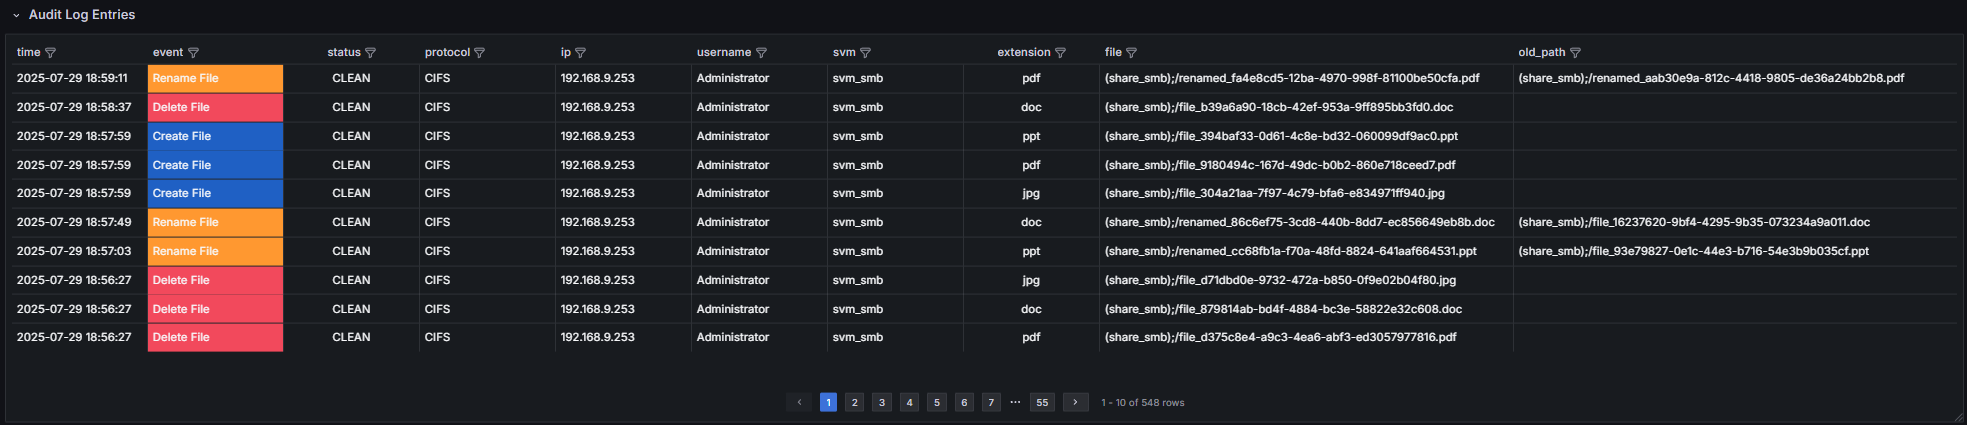
Audit Log Entries
This Audit Log Entries table serves as a forensic goldmine, allowing security analysts and administrators to delve into the specifics of each recorded event. The clear categorization by event type, along with crucial details like IP, username, and especially file extension and path, provides the necessary context to quickly identify, investigate, and respond to potential security incidents, particularly ransomware attacks indicated by anomalous file operations and extensions.
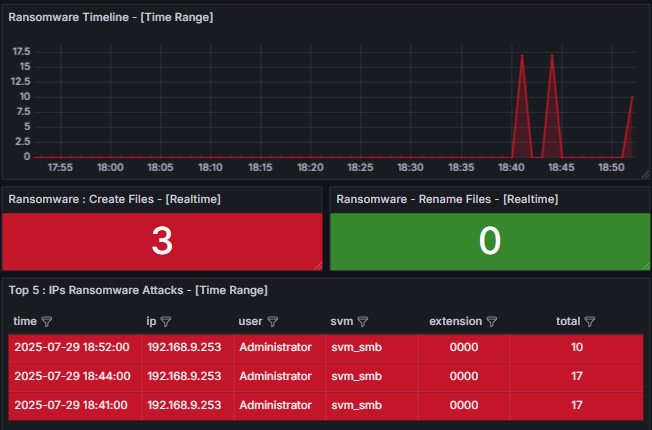
Ransomware Timeline
This “Ransomware Timeline” dashboard is an indispensable tool for proactive ransomware defense. By presenting a clear timeline of attacks, real-time activity metrics, and detailed top attack sources, it empowers organizations to detect ransomware sessions quickly, understand their scope, and initiate effective response procedures to protect critical data and maintain business continuity.
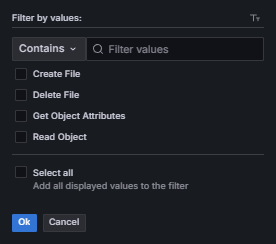
Filter by values
Refine your view by selecting specific values within each column to focus on the data you need.
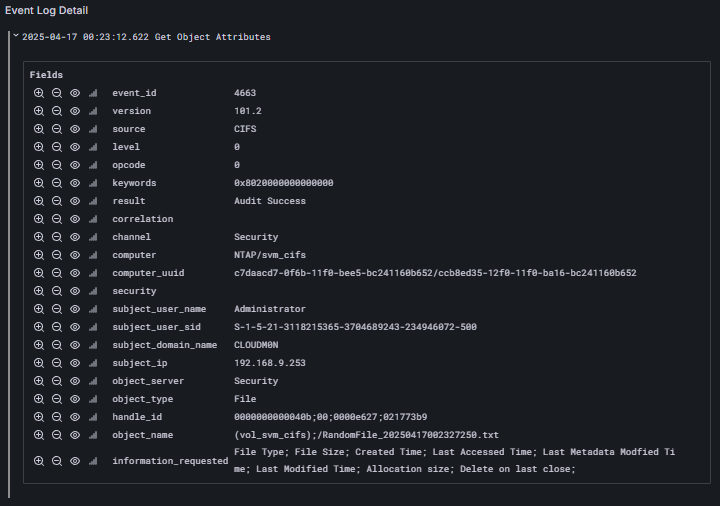
Detailed Event View
Select specific events to display detailed information.
Use the “Event Log No.” search bar to instantly find and view all detailed logs associated with a particular event identifier.
Filter by values
Explore comprehensive information for each logged event, including timestamps, IDs, protocols, status, involved servers (SVMs), users, source IPs, file paths, and specific event attributes, providing a granular view of system activity
Ransomware Dashboard
dashboard provides a unified, real-time view for immediate detection detailed analysis, and effective response to ransomware threats.
Designed for security teams, it consolidates critical information from various sources into an intuitive interface.
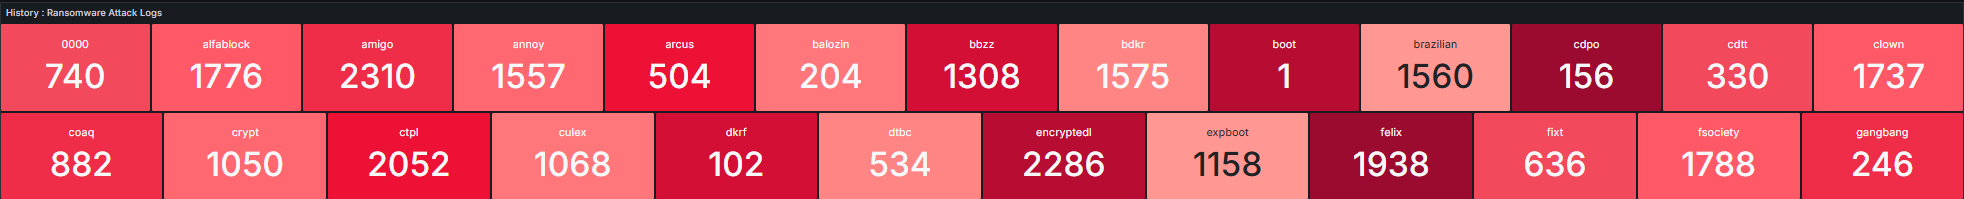
History : Ransomware
panel serves as an essential component of a comprehensive ransomware defense strategy. It quickly summarizes past attack trends by ransomware extension, enabling security analysts
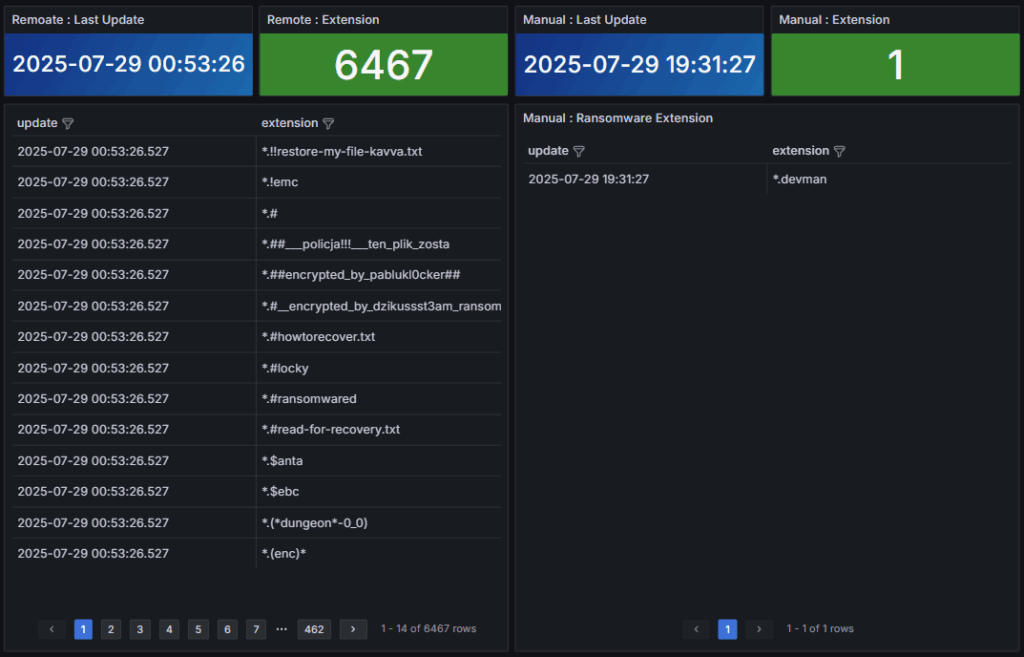
Database : Ransomware
By consolidating and managing ransomware extension data from both external sources and manual inputs, we ensure our system can effectively identify and protect your critical data from ransomware attacks with maximum efficiency.
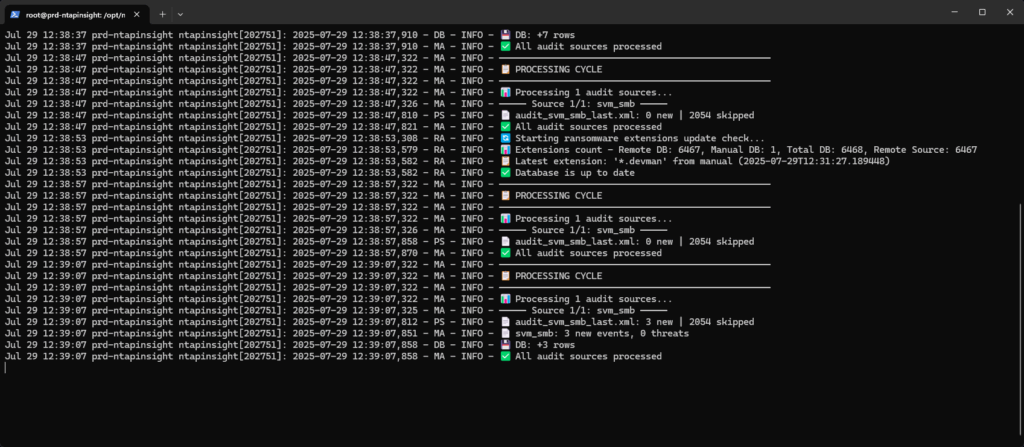
Activity Log
Displays the current activity and logs of the ntapinsight service
This section shows the live output of the ntapinsight service, indicating its progress in tasks like mount checks, configuration processing for SVMs, and database interactions (inserting events).
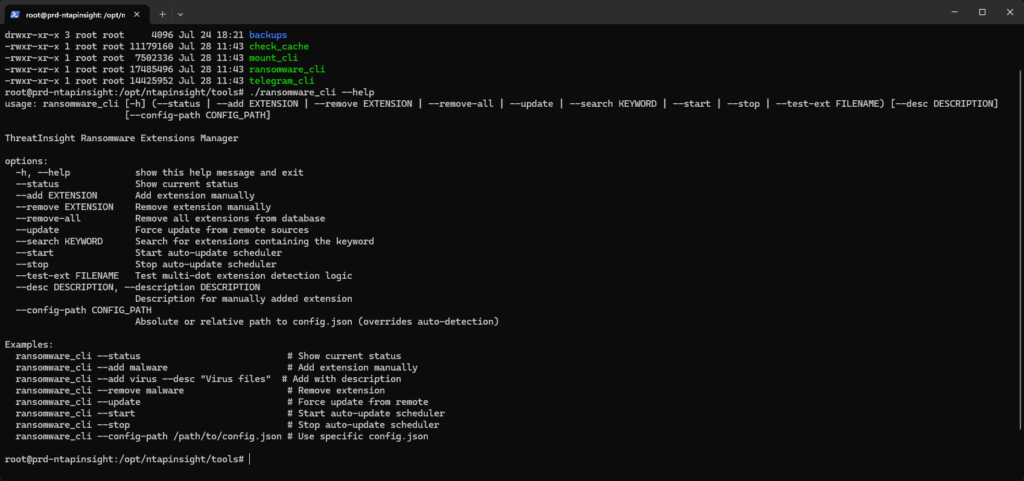
NtapInsight Tools
Ransomware_Cli
The command-line interface (CLI) for ransomware_cli, a powerful tool within the NTAPINSIGHT suite designed for managing and interacting with the Ransomware Extension Database. This tool empowers administrators to effectively control how ransomware threat intelligence is handled within their system
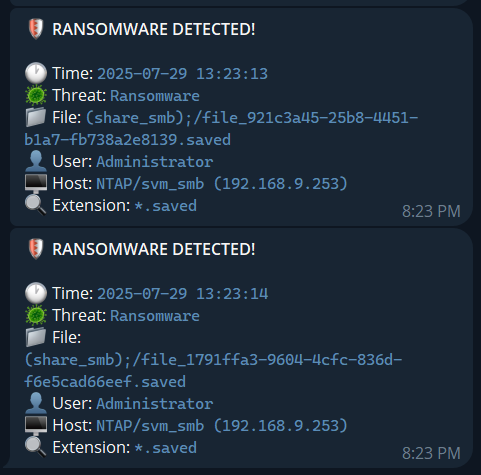
Notification
telegram
This feature significantly reduces the Mean Time To Respond (MTTR) to ransomware attacks. By providing real-time, detailed, and easily accessible alerts, NTAPINSIGHT enables organizations to mitigate potential damage, minimize downtime, and maintain business continuity more effectively against ever-evolving ransomware threats.